AIPL RESEARCH REPORT
SCC7
(3-06) |
Somatic cell counts of milk from Dairy Herd Improvement herds
during 2005 R.H. Miller and H.D. Norman
Animal
Improvement Programs Laboratory, ARS-USDA, Beltsville, MD 20705-2350
301-504-8334 (voice) ~ 301-504-8092 (fax) ~
rlaipl@aipl.arsusda.gov ~
http://aipl.arsusda.gov |
Test-day data from all herds enrolled in Dairy Herd Improvement
(DHI) somatic cell testing during 2005 (93% of all DHI herds) were examined to assess the status of national milk
quality. All test-day data within a herd were included regardless of breed;
data from owner-sampler herds were included as well. Data from cows with
records that failed Animal Improvement Programs Laboratory (AIPL)
editing procedures (for example, no sire identification) were excluded.
Nevertheless, an earlier report
showed that the somatic cell counts (SCC's) of milk from such cows did
not differ appreciably from those from the other cows in the herd. Somatic cell
score (SCS) is reported to AIPL as part of an individual cow's test-day
yield information. It was converted back to SCC in cells/milliliter [SCC =
2(SCS–3) × 100,000] for
calculating herd and State averages.
Table 1 shows the total number of herd test days, the
average number of cows (with usable records) per herd on test day, the average
test-day milk yield and SCC, and the percentages of herd test days that
exceeded four levels of SCC (750,000, 600,000, 500,000, and 400,000 cells/ml)
for each State during 2005. The current
legal limit for bulk
tank SCC is 750,000 cells/ml for Grade A producers; the lower limits shown
have been proposed on a number of occasions as future maximums by the National
Mastitis Council. State and national average daily milk yields were weighted by
the number of cows per herd test day. Herd, State, and national average SCC's
were based on SCC's from individual cows that were weighted by milk yield on
test day. Percentages of herd test days by level of SCC are for herd test days
that included records of at least ten cows. Nationally, average SCC during 2005
was 296,000 cells/ml, which is slightly higher than last year, following three
consecutive years of decline.
Variation among States (Table 1) was large. State
average SCC's were often lower than the national average in the Northeast and
the far West and higher in the Southeast, a finding consistent with previous
reports. Although climatic conditions (temperature and humidity) surely
contributed to regional SCC differences, SCC differences between geographically
adjacent states were substantial, which suggests that mastitis-control regimens
have an impact under similar climatic conditions.
Corresponding averages for earlier years 1995 through 2004 are in
Table 2. The percentage of herd test days that exceeded
750,000, 600,000, 500,000, and 400,000 cells/ml during 2005 was 4.7, 9.2, 15.3
and 25.8, respectively. The overall percentage of herd test days exceeding
750,000 cells/ml was the same in 2005 as in 2004 (Table 2)
while those exceeding the other levels were slightly lower. Thus, 4.7% of test
days from DHI herds that participated in somatic cell testing are higher than
the present legal limit for SCC of bulk tank milk. This percentage may
overestimate the percentage of herds that shipped milk exceeding the legal
limit for bulk tank SCC on test day because the milk of cows treated for
mastitis is excluded from the bulk tank even though included in DHI test data.
Also, the percentage of herd test days that exceeded the legal limit would have
been higher than the percentage of herds that were rejected from the market
because market exclusion only occurs after repeat violations.
Herd size and average daily milk yield have been increasing since 1995
(Table 2). The trend for SCC over the last four years are
somewhat encouraging, but it is too early to determine whether mean SCC will
decline in the future due to genetic selection or improved management
practices. The trends for increasing percentage of herd test days above three
thresholds (600,000, 500,000 and 400,000 cells/ml) no longer show statistically
significant increases as in the past. The concerted effort to improve milk
quality needs to continue. State and national SCC's in DHI will continue to be
summarized annually so changes in SCC and implications to milk quality can be
monitored.
Table 3 provides milk yield and SCC by estimated herd
size. As herd size increased, average daily milk generally increased, and
average SCC declined until herd size exceeded 500 cows. Possibly the most
disturbing result was the percentage of test days with over 750,000 cells/ml.
For herds with less than 50 cows, this occurred around 7.0% of the time. It
occurred on 2.1% of the test days for herds with 50 to 99 cows and on 1.2% of
the test days for all other herd size groups.
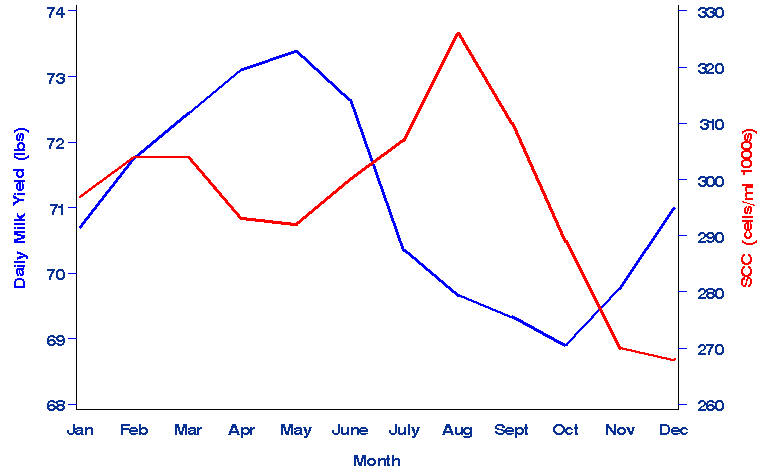
Table 4 provides the same statistics for all herds by
month. The seasonal pattern of milk quality is illustrated in Figure 1. Milk yield per cow was highest in the spring. Milk
yield and quality decline during the summer months, and the highest quality
milk is produced in late fall to early winter.
Table 1. Characteristics of DHI herd test days
for milk yield and SCC of milk by State during 2005.
SCC characteristics
| |
Herd test days1 |
Cows2 per herd |
Average daily milk yield |
Average SCC |
Herd test days3 with SCC greater than |
| State |
(no.) |
(no.) |
(lbs) |
(cells/ml, 1000's) |
750,000 cells/ml
(%) |
600,000 cells/ml
(%) |
500,000 cells/ml
(%) |
400,000 cells/ml
(%) |
| Alabama |
305 |
88.1 |
51.5 |
433 |
5.2 |
13.4 |
23.6 |
47.5 |
| Arizona |
329 |
851.4 |
68.0 |
353 |
4.0 |
7.6 |
15.5 |
30.1 |
| Arkansas |
303 |
71.1 |
58.4 |
448 |
11.9 |
20.5 |
29.4 |
42.2 |
| California |
9,825 |
537.6 |
73.5 |
306 |
4.5 |
8.2 |
13.6 |
24.4 |
| Colorado |
369 |
293.3 |
77.5 |
264 |
1.1 |
2.7 |
4.3 |
10.8 |
| Connecticut |
838 |
77.7 |
69.6 |
288 |
3.6 |
7.8 |
13.0 |
22.6 |
| Delaware |
258 |
100.2 |
69.5 |
344 |
4.3 |
7.0 |
14.3 |
28.7 |
| Florida |
237 |
318.6 |
72.9 |
473 |
16.0 |
32.9 |
46.4 |
65.8 |
| Georgia |
1,141 |
78.9 |
63.1 |
433 |
11.3 |
21.7 |
34.4 |
50.5 |
| Idaho |
1,759 |
376.2 |
76.4 |
267 |
3.9 |
7.3 |
11.4 |
18.6 |
| Illinois |
4,766 |
58.8 |
68.6 |
313 |
4.1 |
8.5 |
14.4 |
26.5 |
| Indiana |
3,712 |
45.3 |
67.2 |
362 |
8.7 |
15.4 |
23.4 |
36.7 |
| Iowa |
9,359 |
55.8 |
69.9 |
303 |
4.5 |
8.9 |
15.0 |
27.0 |
| Kansas |
2,289 |
62.9 |
67.4 |
356 |
8.4 |
15.8 |
24.7 |
37.6 |
| Kentucky |
1,717 |
51.4 |
65.0 |
392 |
11.3 |
20.3 |
30.8 |
45.1 |
| Louisiana |
473 |
63.7 |
55.1 |
416 |
9.7 |
20.9 |
33.0 |
54.5 |
| Maine |
1,196 |
57.7 |
65.0 |
311 |
3.9 |
8.1 |
14.4 |
24.5 |
| Maryland |
3,639 |
67.7 |
67.0 |
314 |
3.8 |
8.4 |
14.8 |
27.4 |
| Massachusetts |
891 |
64.5 |
67.2 |
292 |
1.9 |
5.8 |
13.4 |
23.6 |
| Michigan |
7,547 |
73.7 |
74.9 |
292 |
5.2 |
9.7 |
15.6 |
25.8 |
| Minnesota |
26,570 |
63.3 |
66.6 |
312 |
5.2 |
11.1 |
18.4 |
30.9 |
| Mississippi |
381 |
83.3 |
64.1 |
386 |
6.0 |
11.8 |
20.7 |
37.5 |
| Missouri |
3,564 |
44.9 |
62.0 |
385 |
8.6 |
15.5 |
23.2 |
35.2 |
| Montana |
433 |
90.2 |
74.0 |
205 |
1.6 |
2.5 |
3.2 |
8.1 |
| Nebraska |
1,764 |
72.5 |
69.1 |
337 |
7.0 |
11.8 |
18.9 |
30.6 |
| Nevada |
107 |
361.3 |
73.7 |
387 |
12.1 |
18.7 |
20.6 |
36.4 |
| New Hampshire |
929 |
73.3 |
71.3 |
257 |
1.8 |
5.6 |
9.8 |
18.0 |
| New Jersey |
577 |
64.2 |
69.6 |
318 |
7.5 |
13.5 |
20.6 |
34.0 |
| New Mexico |
286 |
702.2 |
73.9 |
311 |
1.4 |
3.8 |
11.5 |
22.7 |
| New York |
21,171 |
81.8 |
71.0 |
260 |
3.8 |
7.9 |
13.1 |
22.7 |
| North Carolina |
1,744 |
87.5 |
66.8 |
358 |
7.5 |
13.8 |
23.0 |
37.7 |
| North Dakota |
415 |
72.9 |
68.2 |
266 |
1.4 |
4.1 |
7.0 |
14.9 |
| Ohio |
8,803 |
62.6 |
67.4 |
302 |
5.7 |
10.3 |
16.4 |
27.5 |
| Oklahoma |
670 |
67.5 |
62.5 |
363 |
5.8 |
12.2 |
23.3 |
37.0 |
| Oregon |
2,359 |
134.6 |
68.5 |
236 |
3.5 |
5.3 |
7.8 |
14.2 |
| Pennsylvania |
42,677 |
47.1 |
69.6 |
296 |
4.1 |
8.3 |
14.3 |
24.6 |
| Puerto Rico |
469 |
44.9 |
40.6 |
429 |
17.3 |
25.2 |
33.9 |
47.5 |
| Rhode Island |
49 |
33.1 |
64.9 |
173 |
0.0 |
0.0 |
6.1 |
6.1 |
| South Carolina |
549 |
122.8 |
62.4 |
387 |
4.2 |
11.1 |
20.9 |
33.7 |
| South Dakota |
1,459 |
71.6 |
69.2 |
326 |
5.2 |
10.9 |
19.4 |
32.4 |
| Tennessee |
1,655 |
61.0 |
60.7 |
504 |
18.9 |
33.5 |
46.5 |
61.3 |
| Texas |
1,452 |
190.6 |
64.3 |
346 |
3.1 |
7.6 |
17.2 |
33.2 |
| Utah |
1,723 |
133.2 |
72.7 |
265 |
3.5 |
6.6 |
11.4 |
19.9 |
| Vermont |
3,888 |
66.7 |
67.1 |
265 |
2.0 |
4.7 |
9.5 |
17.2 |
| Virginia |
4,455 |
83.9 |
69.0 |
320 |
3.6 |
7.8 |
14.4 |
28.5 |
| Washington |
1,939 |
208.9 |
75.6 |
249 |
2.5 |
3.5 |
5.6 |
9.8 |
| West Virginia |
466 |
65.6 |
62.5 |
373 |
8.8 |
17.4 |
25.1 |
39.9 |
| Wisconsin |
53,049 |
61.8 |
73.8 |
266 |
4.1 |
7.7 |
12.5 |
21.2 |
| Wyoming |
29 |
149.7 |
77.5 |
259 |
6.9 |
6.9 |
13.8 |
27.6 |
| United States |
234,585 |
90.3 |
71.1 |
296 |
4.7 |
9.2 |
15.3 |
25.8 |
| 1All herd test days with usable records. |
| 2Cows with usable records (less than total cows on test). |
| 3Herd test days with ≥10 usable records. |
Table 2. National averages of herd test days for
milk yield and SCC of milk by year.
SCC characteristics
| |
Herd test days1 |
Cows2 per herd |
Average daily milk yield |
Average SCC |
Herd test days3 with SCC greater
than |
| Year |
(no.) |
(no.) |
(lbs) |
(cells/ml, 1000's) |
750,000 cells/ml
(%) |
600,000 cells/ml
(%) |
500,000 cells/ml
(%) |
400,000 cells/ml
(%) |
| 1995 |
265,844 |
50.0 |
65.3 |
304 |
4.1 |
9.3 |
16.0 |
27.2 |
| 1996 |
255,039 |
55.5 |
64.7 |
308 |
4.1 |
9.2 |
16.1 |
27.8 |
| 1997 |
287,789 |
57.4 |
66.4 |
314 |
4.2 |
9.5 |
16.6 |
28.8 |
| 1998 |
283,695 |
60.8 |
66.8 |
318 |
4.5 |
10.1 |
17.8 |
30.3 |
| 1999 |
273,364 |
67.0 |
68.2 |
311 |
4.3 |
9.7 |
17.1 |
29.8 |
| 2000 |
260,139 |
73.3 |
69.1 |
316 |
4.1 |
9.4 |
16.8 |
29.5 |
| 2001 |
244,940 |
79.1 |
69.0 |
322 |
4.9 |
10.6 |
18.2 |
31.1 |
| 20024 |
267,809 |
77.5 |
69.5 |
320 |
5.6 |
11.0 |
18.1 |
30.0 |
| 2003 |
251,182 |
80.5 |
69.6 |
319 |
5.6 |
11.2 |
18.4 |
30.4 |
| 2004 |
240,938 |
85.7 |
69.4 |
295 |
4.7 |
9.4 |
15.5 |
26.4 |
| 2005 |
234,585 |
90.3 |
71.1 |
296 |
4.7 |
9.2 |
15.3 |
25.8 |
| Annual trend |
-3,772 |
4.0*** |
0.6*** |
-1.0 |
0.1* |
0.0 |
-0.0 |
-0.2 |
| 1All herd test days with usable records. |
| 2Cows with usable records (less than total cows on
test). |
| 3Herd test days with ≥10 usable
records. |
| 4Summary characteristics for 2002 were recalculated
to include more complete data than was available at the time of initial
reporting. |
*The linear regression was significant with P
≤ .05
**The linear regression was significant with P
≤ .01
***The linear regression was significant with P
≤ .001 |
Table 3. Characteristics of DHI herd test days
for milk yield and SCC during 2005, by herd size.
SCC characteristics by herd size
| Herd size1 |
Herd test days2 |
Cows3 per herd |
Average daily milk yield |
Average SCC |
Herd test days4 with SCC greater than |
| (cows) |
(no.) |
(no.) |
(lbs) |
(cells/ml, 1000's) |
750,000 cells/ml
(%) |
600,000 cells/ml
(%) |
500,000 cells/ml
(%) |
400,000 cells/ml
(%) |
| <50 |
132,748 |
25.5 |
63.3 |
322 |
7.0 |
12.5 |
19.1 |
29.3 |
| 50 - 99 |
60,150 |
68.4 |
68.0 |
301 |
2.1 |
5.9 |
11.8 |
23.4 |
| 100 - 149 |
15,605 |
120.1 |
69.6 |
292 |
1.3 |
4.0 |
9.3 |
20.1 |
| 150 - 199 |
7,200 |
171.9 |
71.0 |
288 |
1.4 |
4.2 |
8.2 |
18.3 |
| 200 - 299 |
6,586 |
241.4 |
72.7 |
285 |
1.1 |
3.0 |
6.9 |
18.0 |
| 300 - 499 |
5,734 |
389.8 |
74.7 |
279 |
0.9 |
2.8 |
6.2 |
14.6 |
| 500 - 999 |
4,231 |
699.5 |
75.8 |
295 |
1.7 |
3.9 |
7.8 |
16.7 |
| 1000 - 1999 |
1,868 |
1319.6 |
75.7 |
300 |
1.1 |
3.7 |
8.5 |
19.5 |
| 2000 - 2999 |
318 |
2420.2 |
77.4 |
278 |
0.6 |
1.6 |
3.1 |
9.1 |
| >3000 |
145 |
3720.4 |
74.4 |
281 |
0.0 |
0.0 |
0.7 |
8.3 |
| All herds |
234,585 |
90.3 |
71.1 |
296 |
4.7 |
9.2 |
15.3 |
25.8 |
| 1Number of cows reported in milk. |
| 2All herd test days with usable records. |
| 3Cows with usable records (less than total cows on test). |
| 4Herd test days with ≥10 usable records. |
Table 4. Characteristics of DHI herd test days
for milk yield and SCC during 2005, by month.
SCC seasonal characteristics
| |
Herd test days1 |
Cows2 per herd |
Average daily milk yield |
Average SCC |
Herd test days3 with SCC greater than |
| Month |
(no.) |
(no.) |
(lbs) |
(cells/ml, 1000's) |
750,000 cells/ml
(%) |
600,000 cells/ml
(%) |
500,000 cells/ml
(%) |
400,000 cells/ml
(%) |
| January |
19,589 |
87.0 |
70.7 |
297 |
4.3 |
7.9 |
13.7 |
23.5 |
| February |
19,138 |
88.0 |
71.8 |
304 |
4.9 |
9.0 |
14.4 |
24.1 |
| March |
20,706 |
90.6 |
72.4 |
304 |
4.4 |
8.5 |
14.2 |
23.9 |
| April |
20,171 |
90.8 |
73.1 |
293 |
4.1 |
8.1 |
13.5 |
23.6 |
| May |
19,521 |
90.5 |
73.4 |
292 |
3.9 |
7.6 |
12.8 |
22.3 |
| June |
19,527 |
89.4 |
72.6 |
300 |
4.4 |
8.8 |
14.6 |
25.0 |
| July |
19,604 |
90.9 |
70.4 |
307 |
5.6 |
10.9 |
17.7 |
29.3 |
| August |
18,888 |
90.0 |
69.7 |
326 |
6.6 |
12.7 |
20.4 |
33.6 |
| September |
19,256 |
90.9 |
69.3 |
310 |
6.0 |
11.9 |
19.2 |
31.5 |
| October |
19,411 |
91.3 |
68.9 |
289 |
4.8 |
9.7 |
16.2 |
27.3 |
| November |
18,705 |
91.7 |
69.8 |
270 |
3.8 |
7.8 |
13.2 |
22.8 |
| December |
20,069 |
92.0 |
71.0 |
268 |
4.1 |
7.9 |
13.4 |
23.2 |
| Yearly |
234,585 |
90.3 |
71.1 |
296 |
4.7 |
9.2 |
15.3 |
25.8 |
| 1All herd test days with usable records. |
| 2Cows with usable records (less than total cows on test). |
| 3Herd test days with ≥10 usable records. |
Figure 1. Average daily milk yield and Average
SCC during 2005, by month.
SCC seasonal characteristics