 CDCB RESEARCH REPORT
SCC17 (2-16) |
Somatic cell counts of milk from Dairy Herd Improvement herds duringH.D. Norman, L.M. Walton, and João DürrCouncil on Dairy Cattle Breeding, Beltsville, MD 20705-2350 301-525-2006 ~ duane.norman@uscdcb.com ~ https://uscdcb.com |
Test-day data from all herds enrolled in Dairy Herd Improvement (DHI) somatic cell testing during 2015 (98.4% of all DHI herds and 96.4% of DHI cows) were examined to document the status of national milk quality. All test-day data within herds on any DHI test plan (including owner-sampler recording) were included. Somatic cell score (SCS) of milk is reported to the Council on Dairy Cattle Breeding as part of an individual cow's test-day yield information. The test-day data used by the Council on Dairy Cattle Breeding were provided by the dairy records processing centers. The SCS was converted back to a milk somatic cell count (SCC) in cells per milliliter [SCC = 2(SCS − 3) × 100,000] for calculating herd and state averages.
Table 1 shows total number of herd test days, average number of cows with usable records per herd on test day, average test-day milk yield and herd SCC, and percentages of herd test days that exceeded four levels of SCC (750,000, 600,000, 500,000, and 400,000 cells/mL) for each state during (it also includes a few Mexican herds tested through the U.S. DHI system). The current legal limit for bulk tank SCC is 750,000 cells/mL for Grade A producers; lowering the limit to 400,000 cells/mL has been proposed periodically by a number of dairy organizations (Norman et al., 2011). A few states have lowered their SCC limits beyond the federal requirements. State and national average daily milk yields were weighted by number of cows per herd test day. Herd, state, and national average SCCs were based on SCCs from individual cows that were weighted by milk yield on test day. Percentages of herd test days by SCC level are for herd test days that included records from at least 10 cows. Nationally, average test-day herd SCC during 2015 was 204,000 cells/mL, which was slightly higher (by 4,000 cells/mL) than last year's average.
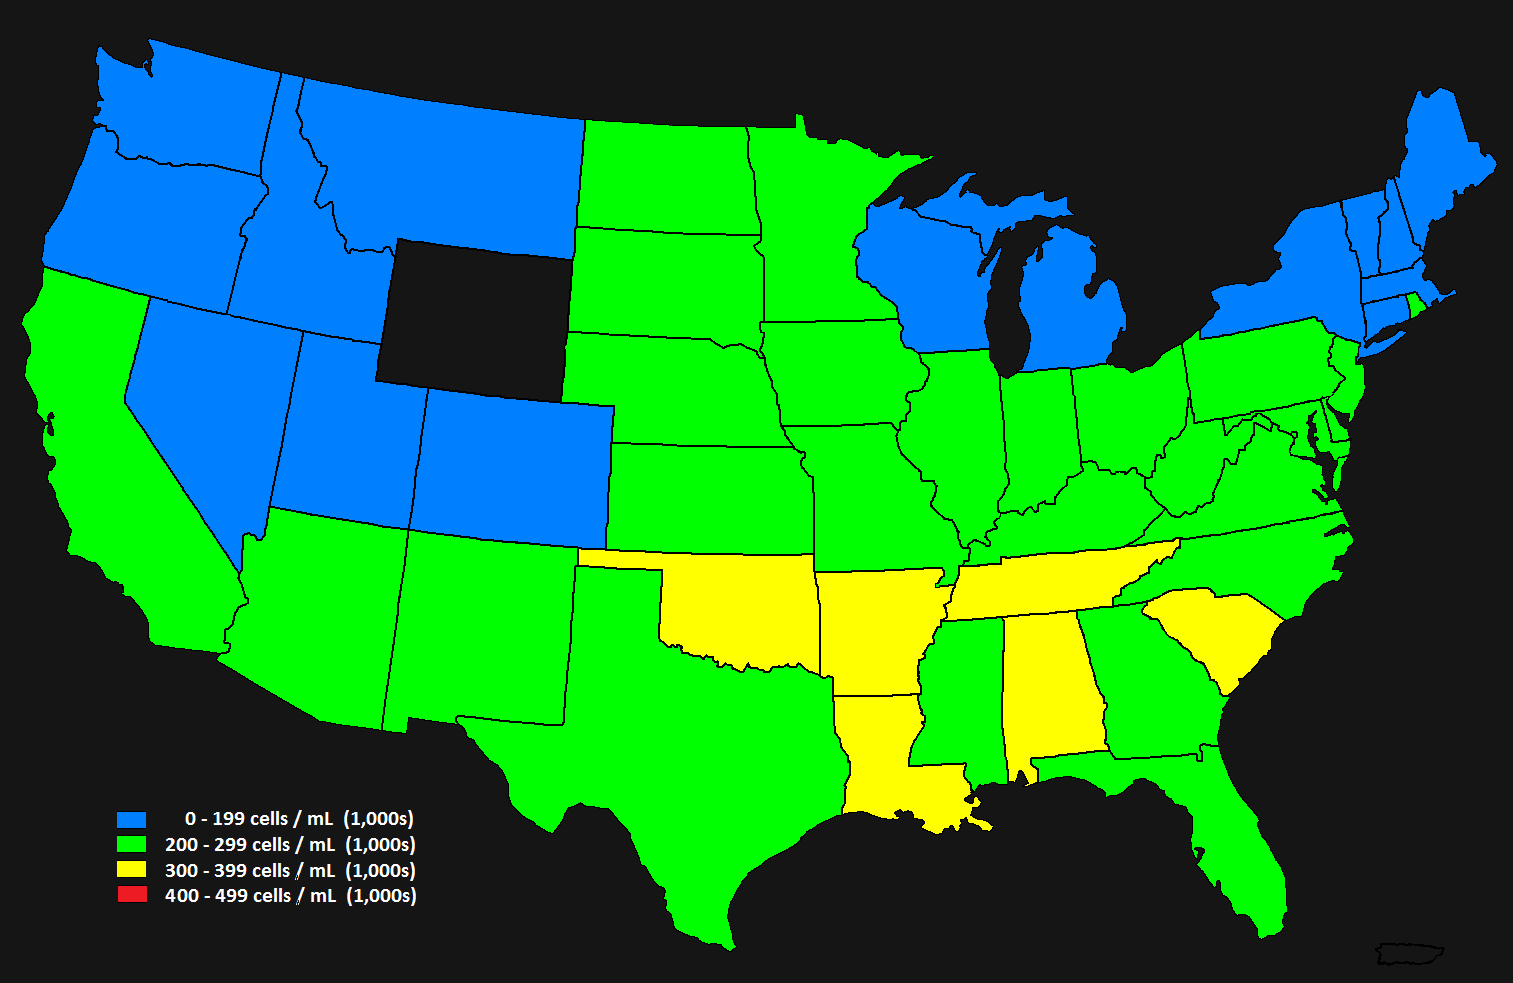
Variation among states (Table 1) remains large. State average SCC generally was lower than the national average for the northeastern, mountain, and western states and often higher for a few southeastern states (Figure 1). Although climatic conditions (temperature and humidity) surely contributed to regional SCC levels, differences between adjacent states were substantial, suggesting herd size and mastitis-control practices are impacting state differences as well.
Corresponding national averages for 1995 through are in Table 2. National average test-day herd SCC had declined every year except three since 2001, which had the highest SCC at 322,000 cells/mL. The percentage of herd test days that exceeded 750,000, 600,000, 500,000, and 400,000 cells/mL during 2015 was 1.6, 3.3, 6.0, and 11.6, respectively. The 2015 DHI herd test days that were higher than the present legal limit for bulk tank SCC (1.6%) overestimate the actual percentage of herds that shipped milk exceeding the legal limit because milk of cows treated for mastitis is excluded from the bulk tank even though included in DHI test data. The percentage of herd test-days that exceeded the legal limit also would have been higher than the percentage of herds that were rejected from the market because market exclusion only occurs after repeated violations. The phenomenal reduction in SCC evident over the previous decade may be ending as there are now two consecutive years with a small increase.
Herd size and average test-day milk yield have been increasing (Table 2). The increase in cows per herd continued from 177.3 in 2014 to 185.9 in 2015. Test-day milk yield was up from 76.2 to 77.2 pounds. The large decline in SCC since 2001 has been beneficial and hopefully a reduction will continue as a result of improved management practices and directed culling. Genetic selection is expected to contribute more to future improvement in milk quality than in the past. The trend for lower percentage of herd test-days above the thresholds is likewise encouraging. Milk quality has probably benefitted from the European Union standards which are being forced upon many of the US dairy producers. State and national SCCs for DHI herds will continue to be summarized annually so that changes in SCCs and implications for milk quality can be monitored.
Table 3 reports average test-day milk yield and herd SCC during by herd size. As herd size increased, milk yield generally increased and SCC declined. A remaining concern is the percentage of test days for small herds over the current and proposed limits. If the limit was set at 400,000 cell/mL, 17.0% of monthly tests would fall above the limit for herds with fewer than 50 cows, 11.0% for herds with 50 to 99 cows, 8.4% for herds with 100 to 149 cows, and only 0.8% for herds with over 3,000 cows. Because small herds contribute less each year to the total milk supply (see herd-average reports), the general trend is for improved milk quality as large herds have lower SCCs on the average.
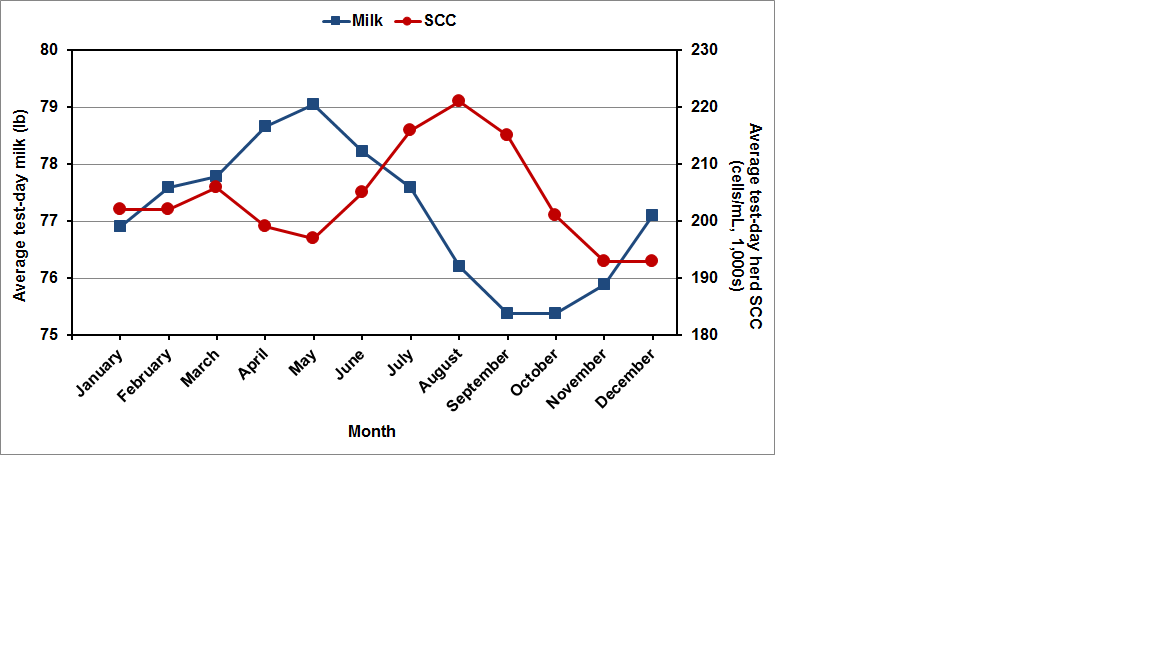
Table 4 reports average test-day milk yield and herd SCC during by month, and the seasonal pattern for milk quality is shown in Figure 2. Milk yield per cow was highest in the spring and declined through the summer months; SCC increased from May through August and then declined quickly from August through November. The highest quality milk was produced in November and December.
|
Table 1. Characteristics of test-day milk yield and somatic cell count (SCC) from Dairy Herd Improvement herds by state during |
| Herd test days1 | Cows2 per herd | Average daily milk yield | Average SCC | Herd test days3 with SCC greater than | ||||
| State | (no.) | (no.) | (lb) | (cells/ml, 1000's) | 750,000 cells/ml (%) |
600,000 cells/ml (%) |
500,000 cells/ml (%) |
400,000 cells/ml (%) |
| Alabama | 155 | 94.6 | 51.9 | 367 | 1.9 | 11.6 | 23.2 | 36.1 |
| Arizona | 162 | 1525.7 | 73.2 | 213 | 0.6 | 3.1 | 3.1 | 6.8 |
| Arkansas | 153 | 101.5 | 54.3 | 386 | 8.5 | 13.1 | 21.6 | 34.0 |
| California | 6,822 | 953.6 | 76.9 | 204 | 1.3 | 2.1 | 3.5 | 6.3 |
| Colorado | 262 | 1197.7 | 77.5 | 197 | 1.1 | 1.9 | 1.9 | 5.0 |
| Connecticut | 721 | 129.2 | 75.5 | 198 | 1.0 | 2.4 | 5.7 | 12.2 |
| Delaware | 182 | 176.5 | 76.9 | 232 | 0.0 | 0.0 | 0.0 | 4.4 |
| Florida | 237 | 926.1 | 74.9 | 245 | 0.8 | 3.8 | 10.5 | 17.7 |
| Georgia | 788 | 231.1 | 71.4 | 264 | 1.9 | 4.1 | 9.5 | 21.6 |
| Idaho | 1,282 | 1303.5 | 78.9 | 178 | 0.4 | 0.9 | 1.4 | 3.7 |
| Illinois | 2,926 | 123.4 | 76.4 | 231 | 1.5 | 4.3 | 7.4 | 15.2 |
| Indiana | 2,452 | 116.6 | 75.7 | 214 | 1.0 | 3.1 | 5.8 | 11.8 |
| Iowa | 5,624 | 159.6 | 78.5 | 209 | 2.0 | 4.1 | 7.1 | 13.0 |
| Kansas | 1,295 | 99.3 | 69.8 | 254 | 2.1 | 5.8 | 11.7 | 20.3 |
| Kentucky | 1,220 | 91.2 | 74.4 | 221 | 4.2 | 5.7 | 9.5 | 17.1 |
| Louisiana | 242 | 95.4 | 54.7 | 379 | 5.8 | 15.3 | 29.3 | 50.4 |
| Maine | 1,204 | 105.0 | 70.9 | 188 | 0.4 | 1.2 | 3.2 | 7.6 |
| Maryland | 2,582 | 101.7 | 71.6 | 219 | 2.4 | 5.3 | 8.7 | 15.2 |
| Massachusetts | 655 | 64.2 | 66.8 | 185 | 0.9 | 2.4 | 4.3 | 6.9 |
| Mexico | 55 | 1245.7 | 66.5 | 251 | 0.0 | 0.0 | 0.0 | 1.8 |
| Michigan | 5,866 | 240.2 | 81.9 | 155 | 0.6 | 1.2 | 2.3 | 4.7 |
| Minnesota | 17,010 | 119.5 | 77.8 | 245 | 1.9 | 4.4 | 8.3 | 16.2 |
| Mississippi | 227 | 154.5 | 65.4 | 273 | 0.9 | 4.4 | 15.0 | 28.6 |
| Missouri | 2,323 | 84.0 | 65.1 | 293 | 3.8 | 7.5 | 12.2 | 21.4 |
| Montana | 198 | 138.5 | 77.9 | 192 | 1.5 | 3.0 | 5.6 | 7.1 |
| Nebraska | 839 | 239.3 | 76.1 | 223 | 2.0 | 4.4 | 11.0 | 21.8 |
| Nevada | 63 | 519.0 | 74.1 | 171 | 0.0 | 0.0 | 0.0 | 0.0 |
| New Hampshire | 677 | 112.8 | 71.3 | 187 | 1.5 | 3.4 | 5.0 | 7.8 |
| New Jersey | 414 | 62.1 | 68.4 | 256 | 0.7 | 2.9 | 6.5 | 14.0 |
| New Mexico | 126 | 3449.5 | 74.4 | 201 | 0.0 | 0.0 | 0.8 | 2.4 |
| New York | 16,115 | 177.5 | 77.8 | 194 | 0.6 | 2.0 | 4.2 | 9.4 |
| North Carolina | 1,128 | 170.6 | 73.4 | 260 | 0.9 | 2.9 | 8.7 | 19.5 |
| North Dakota | 174 | 201.3 | 76.2 | 221 | 1.1 | 1.1 | 5.2 | 9.2 |
| Ohio | 6,848 | 112.8 | 73.4 | 202 | 0.9 | 1.9 | 3.7 | 8.2 |
| Oklahoma | 390 | 81.6 | 62.8 | 304 | 6.4 | 12.3 | 21.8 | 30.3 |
| Oregon | 1,275 | 260.3 | 65.4 | 182 | 1.5 | 1.5 | 3.0 | 6.0 |
| Pennsylvania | 35,125 | 70.5 | 74.8 | 206 | 1.5 | 2.9 | 5.3 | 10.4 |
| Rhode Island | 63 | 44.4 | 65.0 | 216 | 3.2 | 7.9 | 11.1 | 25.4 |
| South Carolina | 326 | 167.8 | 63.3 | 342 | 1.8 | 4.9 | 11.7 | 31.6 |
| South Dakota | 846 | 372.9 | 77.2 | 254 | 1.8 | 4.6 | 7.3 | 14.8 |
| Tennessee | 909 | 105.6 | 65.5 | 328 | 4.1 | 9.7 | 16.8 | 32.1 |
| Texas | 936 | 1044.8 | 65.4 | 224 | 1.5 | 4.3 | 8.0 | 19.2 |
| Utah | 824 | 205.9 | 71.4 | 174 | 1.9 | 2.5 | 4.1 | 6.2 |
| Vermont | 3,018 | 137.0 | 73.5 | 155 | 0.2 | 0.8 | 1.8 | 4.2 |
| Virginia | 3,197 | 136.1 | 73.6 | 251 | 1.7 | 4.1 | 7.8 | 16.5 |
| Washington | 1,301 | 372.6 | 75.4 | 171 | 0.5 | 1.2 | 1.9 | 3.8 |
| West Virginia | 260 | 83.6 | 64.8 | 241 | 0.8 | 1.9 | 5.0 | 15.4 |
| Wisconsin | 37,473 | 141.3 | 83.7 | 196 | 2.1 | 3.9 | 6.3 | 11.4 |
| United States4 | 166,970 | 185.9 | 77.2 | 204 | 1.6 | 3.3 | 6.0 | 11.6 |
| 1All herd test days with usable records. |
| 2Cows with usable records (less than total cows on test). |
| 3Herd test days with ≥10 usable records. |
| 4US Average includes a few records from Mexican herds. |
|
Table 2. National averages for test-day milk yield and somatic cell count (SCC) from Dairy Herd Improvement herds by year |
| Herd test days1 | Cows2 per herd | Average daily milk yield | Average SCC | Herd test days3 with SCC greater than | ||||
| Year | (no.) | (no.) | (lb) | (cells/ml, 1000's) | 750,000 cells/ml (%) |
600,000 cells/ml (%) |
500,000 cells/ml (%) |
400,000 cells/ml (%) |
| 1995 | 265,844 | 50.0 | 65.3 | 304 | 4.1 | 9.3 | 16.0 | 27.2 |
| 1996 | 255,039 | 55.5 | 64.7 | 308 | 4.1 | 9.2 | 16.1 | 27.8 |
| 1997 | 287,789 | 57.4 | 66.4 | 314 | 4.2 | 9.5 | 16.6 | 28.8 |
| 1998 | 283,695 | 60.8 | 66.8 | 318 | 4.5 | 10.1 | 17.8 | 30.3 |
| 1999 | 273,364 | 67.0 | 68.2 | 311 | 4.3 | 9.7 | 17.1 | 29.8 |
| 2000 | 260,139 | 73.3 | 69.1 | 316 | 4.1 | 9.4 | 16.8 | 29.5 |
| 2001 | 244,940 | 79.1 | 69.0 | 322 | 4.9 | 10.6 | 18.2 | 31.1 |
| 20024 | 267,809 | 77.5 | 69.5 | 320 | 5.6 | 11.0 | 18.1 | 30.0 |
| 2003 | 251,182 | 80.5 | 69.6 | 319 | 5.6 | 11.2 | 18.4 | 30.4 |
| 2004 | 240,938 | 85.7 | 69.4 | 295 | 4.7 | 9.4 | 15.5 | 26.4 |
| 2005 | 234,585 | 90.3 | 71.1 | 296 | 4.7 | 9.2 | 15.3 | 25.8 |
| 20065 | 236,191 | 115.5 | 71.2 | 288 | 3.9 | 8.3 | 14.3 | 25.2 |
| 2007 | 227,626 | 125.1 | 71.4 | 276 | 3.5 | 7.6 | 13.4 | 24.0 |
| 2008 | 222,245 | 131.7 | 71.7 | 262 | 3.4 | 7.1 | 12.5 | 22.4 |
| 2009 | 204,195 | 136.1 | 72.1 | 233 | 2.7 | 5.8 | 10.3 | 18.9 |
| 2010 | 198,218 | 145.2 | 72.7 | 228 | 2.7 | 5.7 | 10.0 | 18.0 |
| 2011 | 191,375 | 154.6 | 73.1 | 217 | 2.3 | 4.8 | 8.5 | 15.7 |
| 2012 | 184,927 | 161.8 | 74.2 | 200 | 1.5 | 3.3 | 6.1 | 12.0 |
| 2013 | 177,944 | 167.8 | 75.2 | 199 | 1.5 | 3.2 | 5.9 | 11.6 |
| 2014 | 173,260 | 177.3 | 76.2 | 200 | 1.6 | 3.4 | 6.0 | 11.6 |
| 2015 | 166,970 | 185.9 | 77.2 | 204 | 1.6 | 3.3 | 6.0 | 11.6 |
| Annual trend | -5,777 | 7.1*** | 0.5*** | -6.9*** | -0.2*** | -0.4*** | -0.7*** | -1.0*** |
| 1All herd test days with usable records. |
| 2Cows with usable records (less than total cows on test). |
| 3Herd test days with ≥10 usable records. |
| 4Summary characteristics for 2002 were recalculated to include more complete data than were available at the time of initial reporting. |
| 5Cows per herd included records with missing sire identification starting in 2006; those records were not included in prior years. |
| ***Significant (P ≤ 0.001) linear regression. |
|
Table 3. Characteristics of test-day milk yield and somatic cell count (SCC) from Dairy Herd Improvement herds during by herd size |
| Herd size1 | Herd test days2 | Cows3 per herd | Average daily milk yield | Average SCC | Herd test days4 with SCC greater than | |||
| (cows) | (no.) | (no.) | (lb) | (cells/ml, 1000's) | 750,000 cells/ml (%) |
600,000 cells/ml (%) |
500,000 cells/ml (%) |
400,000 cells/ml (%) |
| <50 | 65,065 | 28.1 | 64.6 | 241 | 3.5 | 6.5 | 10.3 | 17.0 |
| 50 - 99 | 47,842 | 69.8 | 69.9 | 226 | 0.6 | 2.0 | 4.6 | 11.0 |
| 100 - 149 | 16,995 | 120.8 | 72.4 | 218 | 0.2 | 1.2 | 3.3 | 8.4 |
| 150 - 199 | 8,345 | 172.1 | 74.8 | 209 | 0.2 | 0.8 | 2.0 | 6.6 |
| 200 - 299 | 8,544 | 242.3 | 76.9 | 203 | 0.1 | 0.6 | 1.7 | 5.7 |
| 300 - 499 | 7,735 | 384.1 | 80.5 | 199 | 0.2 | 0.5 | 1.4 | 4.4 |
| 500 - 999 | 6,640 | 693.0 | 81.6 | 196 | 0.0 | 0.2 | 0.6 | 2.5 |
| 1000 - 1999 | 3,796 | 1393.3 | 82.2 | 196 | 0.0 | 0.1 | 0.3 | 1.2 |
| 2000 - 2999 | 1,036 | 2435.3 | 78.7 | 199 | 0.1 | 0.3 | 0.7 | 2.0 |
| >3000 | 972 | 5069.1 | 77.2 | 197 | 0.0 | 0.0 | 0.1 | 0.8 |
| All herds | 166,970 | 185.9 | 77.2 | 204 | 1.6 | 3.3 | 6.0 | 11.6 |
| 1Number of cows reported in milk. |
| 2All herd test days with usable records. |
| 3Cows with usable records (less than total cows on test). |
| 4Herd test days with ≥10 usable records. |
|
Table 4. Characteristics of test-day milk yield and somatic cell count (SCC) from Dairy Herd Improvement herds during by month |
| Herd test days1 | Cows2 per herd | Average daily milk yield | Average SCC | Herd test days3 with SCC greater than | ||||
| Month | (no.) | (no.) | (lb) | (cells/ml, 1000's) | 750,000 cells/ml (%) |
600,000 cells/ml (%) |
500,000 cells/ml (%) |
400,000 cells/ml (%) |
| January | 14,523 | 184.1 | 76.9 | 202 | 1.4 | 2.8 | 5.1 | 10.0 |
| February | 13,268 | 189.9 | 77.6 | 202 | 1.5 | 2.9 | 5.4 | 10.0 |
| March | 14,491 | 181.6 | 77.8 | 206 | 1.8 | 3.6 | 6.1 | 11.5 |
| April | 14,362 | 185.9 | 78.7 | 199 | 1.5 | 3.1 | 5.3 | 10.5 |
| May | 14,471 | 187.6 | 79.1 | 197 | 1.3 | 2.7 | 4.9 | 9.9 |
| June | 13,574 | 188.8 | 78.2 | 205 | 1.7 | 3.5 | 6.3 | 12.3 |
| July | 14,059 | 180.8 | 77.6 | 216 | 1.9 | 4.1 | 7.4 | 14.2 |
| August | 13,640 | 186.2 | 76.2 | 221 | 2.2 | 4.9 | 8.9 | 16.5 |
| September | 13,368 | 189.0 | 75.4 | 215 | 1.9 | 4.2 | 7.4 | 14.5 |
| October | 14,205 | 187.9 | 75.4 | 201 | 1.3 | 3.0 | 5.5 | 10.8 |
| November | 12,924 | 184.3 | 75.9 | 193 | 1.2 | 2.6 | 4.7 | 9.3 |
| December | 14,085 | 185.2 | 77.1 | 193 | 1.3 | 2.6 | 4.8 | 9.7 |
| Yearly | 166,970 | 185.9 | 77.2 | 204 | 1.6 | 3.3 | 6.0 | 11.6 |
| 1All herd test days with usable records. |
| 2Cows with usable records (less than total cows on test). |
| 3Herd test days with ≥10 usable records. |
|
Figure 1. Average test-day somatic cell count from Dairy Herd Improvement herds during by state |
|
Figure 2. Average test-day milk yield and somatic cell count (SCC) from Dairy Herd Improvement herds during by month |