 CDCB RESEARCH REPORT
SCC21 (2-20) |
Somatic cell counts of milk from Dairy Herd Improvement herds duringH.D. Norman, F.L. Guinan, L.M. Walton, and João DürrCouncil on Dairy Cattle Breeding, Beltsville, MD 20705-2350 301-525-2006 ~ duane.norman@uscdcb.com ~ https://www.uscdcb.com |
Test-day data from all herds enrolled in Dairy Herd Improvement (DHI) somatic cell testing during (98.4% of all DHI herds and 96.4% of DHI cows) were examined to document the status of national milk quality. All test-day data within herds on any DHI test plan (including owner-sampler recording) were included. Somatic cell score (SCS) of milk is reported to the Council on Dairy Cattle Breeding (CDCB) as part of an individual cow's test-day yield information. The test-day data used by the CDCB were provided by the dairy records processing centers. The SCS was converted back to a milk somatic cell count (SCC) in cells per milliliter [SCC = 2(SCS − 3) × 100,000] for calculating herd and state averages.
Table 1 shows total number of herd test days, average number of cows with usable records per herd on test day, average test-day milk yield, fat and protein percentages, and herd SCC. It also shows the percentages of herd test days that exceeded four levels of SCC (750,000, 600,000, 500,000, and 400,000 cells/mL) for each state during . It also includes a few Mexican herds tested through the U.S. DHI system. The current legal limit for bulk tank SCC is 750,000 cells/mL for Grade A producers; lowering the limit to 400,000 cells/mL has been proposed periodically by a number of dairy organizations (Norman et al., 2011). A few states have lowered their SCC limits beyond the federal requirements. State and national average daily milk, fat and protein yields were weighted by number of cows per herd test day. Fat and protein percentages were determined by dividing their yield averages by millk yield. Herd, state, and national average SCCs were based on SCCs from individual cows that were weighted by milk yield on test day. This weighting assures that SCC and milk component percentages represent all milk produced in the catagories shown. Percentages of herd test days by SCC level are for herd test days that included records from at least 10 cows. Nationally, average DHI SCC during was 187,000 cells/mL, which was lower (by 4,000 cells/mL) than last year's average. In fact, 187,000 cells/mL is the lowest average recorded in DHI since it was first calculated in 1995.
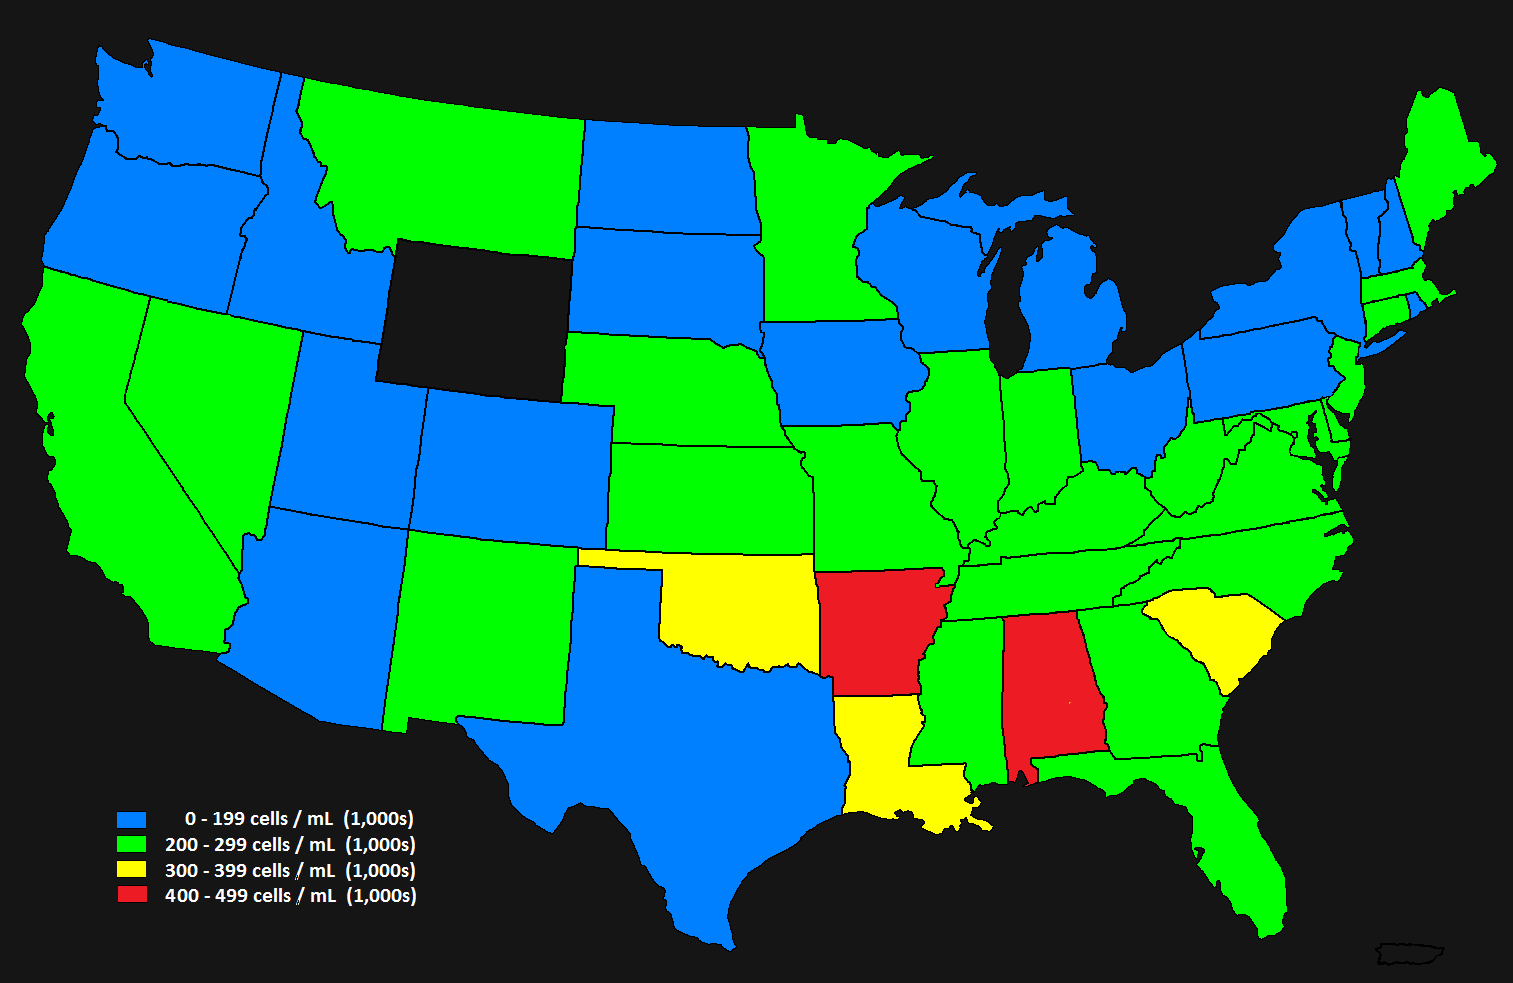
Variation among states (Table 1) remains large. State average SCC generally was lower than the national average for the northeastern, mountain, and western states and often higher for the southeastern states (Figure 1). Although climatic conditions (temperature and humidity) surely contributed to regional SCC levels, differences between adjacent states were substantial, suggesting herd size and mastitis-control practices are impacting state differences as well.
Corresponding national averages for 1995 through are in Table 2. National average test-day herd SCC had declined every year except three since 2001, which had the highest SCC at 322,000 cells/mL. The percentage of herd test days that exceeded 750,000, 600,000, 500,000, and 400,000 cells/mL during was 1.5, 2.9, 5.2, and 9.9, respectively. The DHI herd test days that were higher than the present legal limit for bulk tank SCC (1.5%) overestimate the actual percentage of herds that shipped milk exceeding the legal limit because milk of cows treated for mastitis is excluded from the bulk tank even though included in DHI test data. The percentage of herd test-days that exceeded the legal limit also would have been higher than the percentage of herds that were rejected from the market because market exclusion only occurs after repeated violations. The phenomenal reduction in SCC evident between 2001 and 2012 appeared to have ended for a short time but has again shown a modest decline for the last four years.
Herd size has been increasing (Table 2). The increase in cows per herd was the largest on record, from 222.7 in 2018 to 244.3 in . Test-day milk yield remained unchanged at 78 pounds. The large decline in SCC since 2001 has been beneficial and hopefully a reduction will continue as a result of improved management practices and directed culling. Genetic selection is expected to contribute more to future improvement in milk quality than in the past. The earlier trend for lower percentage of herd test-days above the thresholds has ended. State and national SCCs for DHI herds will continue to be summarized annually so that changes in SCCs and implications for milk quality can be monitored.
Table 3 reports average test-day milk yield and herd SCC during by herd size. As herd size increased up to 3000 cows, milk yield increased. SCC declined as herd size increased up to 500 cows. A remaining concern is the percentage of test days for small herds over the current and possible future limits. If the limit was set at 400,000 cell/mL, 16.0% of monthly tests would fall above the limit for herds with fewer than 50 cows, 9.4% for herds with 50 to 99 cows, 6.1% for herds with 100 to 149 cows, but only 0.3% for herds with over 4,000 cows. Because small herds contribute less each year to the total milk supply (see herd-average reports), the general trend is for improved milk quality as large herds have lower SCCs on the average.
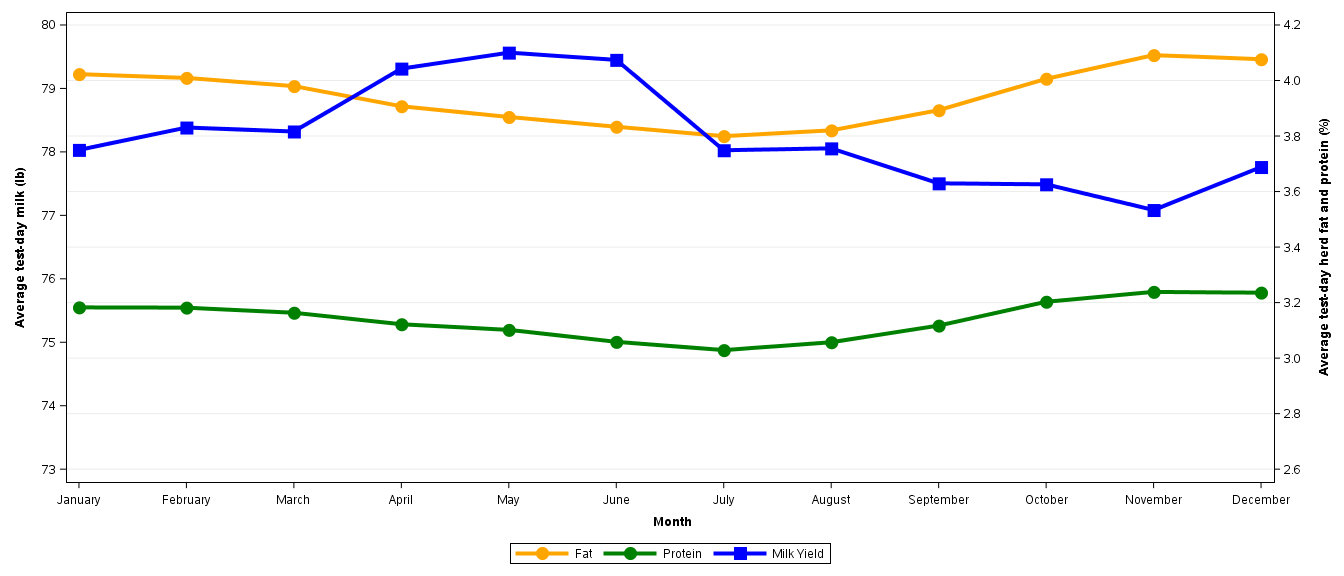
Table 4 reports average test-day milk yield, fat and protein percentages, and herd SCC during by month, and the seasonal pattern for milk quality is shown in Figure 2. Milk yield per cow was highest in the spring and declined until December; SCC increased from April through July and then declined quickly from July through November. The seasonal pattern for fat and protein percentages are shown in Figure 3, new information provided this year. The milk with the lowest SCC and highest fat and protein percentages was produced in November and December.
| Table 1. Characteristics of test-day milk yield, somatic cell count (SCC), fat and protein percentages from Dairy Herd Improvement herds by state during 2019 |
Herd test days1
Cows2 per herd
Average daily milk yield
Average Fat
Average Protein
Average SCC
Herd test days3 with SCC greater than
State
(no.)
(no.)
(lb)
(%)
(%)
(cells/ml, 1000's)
750,000 cells/ml
(%)600,000 cells/ml
(%)500,000 cells/ml
(%)400,000 cells/ml
(%)
Alabama
65
27.0
63.4
3.81
3.05
454
12.3
29.2
40.0
50.8
Arizona
119
2103.5
73.0
3.78
3.12
165
0.0
0.8
0.8
1.7
Arkansas
113
124.6
52.9
3.89
3.26
414
0.9
9.7
22.1
38.9
California
5,521
1127.4
78.0
3.91
3.05
205
0.9
1.8
3.2
7.0
Colorado
296
1325.0
78.4
3.87
3.15
200
1.7
1.7
3.7
6.8
Connecticut
456
143.8
74.2
4.03
3.13
186
2.6
4.8
7.2
11.4
Delaware
133
169.6
77.9
3.93
3.12
202
0.0
0.0
3.0
6.0
Florida
170
1145.5
77.6
3.64
3.07
258
0.6
2.9
3.5
16.5
Georgia
441
211.2
76.4
3.88
3.13
209
3.2
4.1
6.3
14.5
Idaho
1,035
1457.0
79.2
3.92
3.21
164
1.1
1.7
2.4
3.8
Illinois
2,034
150.0
78.7
3.87
3.13
216
2.2
4.4
7.8
13.9
Indiana
1,718
162.9
78.7
3.86
3.14
213
1.6
3.0
6.2
11.6
Iowa
3,781
208.3
79.3
3.96
3.18
194
1.3
3.3
6.2
11.8
Kansas
1,045
198.0
79.6
3.85
3.15
205
2.3
5.0
9.6
18.9
Kentucky
770
116.5
80.7
3.67
3.09
220
2.6
4.3
6.6
10.4
Louisiana
154
84.3
61.3
3.86
3.15
375
11.0
16.9
26.6
42.9
Maine
926
127.3
76.6
4.00
3.13
185
0.8
2.1
4.0
9.1
Maryland
1,766
117.0
71.6
3.90
3.10
199
2.7
4.3
7.0
12.9
Massachusetts
491
57.8
66.8
4.08
3.20
186
2.2
2.2
4.5
10.2
Mexico
9
323.9
76.6
3.73
3.36
234
0.0
0.0
0.0
0.0
Michigan
3,930
338.2
83.6
3.85
3.11
159
0.8
1.4
2.6
4.4
Minnesota
11,626
141.7
77.3
3.96
3.17
208
2.0
4.4
7.6
14.6
Mississippi
198
128.8
59.5
4.08
3.32
294
5.1
9.6
16.2
32.3
Missouri
1,471
77.9
63.3
3.92
3.21
264
3.8
7.5
14.5
24.9
Montana
127
95.2
77.7
3.86
3.07
218
3.1
3.1
4.7
8.7
Nebraska
525
391.2
75.1
3.91
3.19
191
2.1
4.2
8.4
16.2
Nevada
43
754.4
73.1
3.86
3.21
231
0.0
0.0
0.0
7.0
New Hampshire
527
104.9
70.7
4.13
3.19
181
2.7
3.8
5.7
9.1
New Jersey
277
71.8
65.5
3.78
3.12
242
0.7
4.7
7.9
13.0
New Mexico
154
3204.9
78.4
3.65
3.18
213
0.0
0.0
0.6
0.6
New York
11,465
234.6
81.5
3.92
3.10
180
0.6
1.7
4.0
8.4
North Carolina
768
207.5
76.3
4.02
3.14
207
2.2
3.1
4.7
10.4
North Dakota
111
355.9
81.6
3.79
3.16
178
0.9
0.9
9.9
24.3
Ohio
4,566
126.7
76.1
3.96
3.16
182
0.5
1.3
3.1
6.7
Oklahoma
289
76.7
54.7
3.94
3.28
351
6.2
10.0
16.3
27.3
Oregon
837
297.7
64.0
4.45
3.48
174
1.0
1.0
1.9
3.5
Pennsylvania
27,215
78.1
75.1
3.86
3.09
186
1.2
2.3
4.1
8.2
Rhode Island
22
34.7
71.0
4.09
3.21
179
4.5
4.5
4.5
13.6
South Carolina
215
154.4
61.1
4.05
3.26
301
0.0
2.3
7.9
20.5
South Dakota
458
635.2
76.9
4.16
3.23
175
3.3
5.5
10.3
18.1
Tennessee
487
103.0
65.0
4.05
3.18
285
2.3
5.3
8.2
20.9
Texas
752
2343.3
65.5
4.62
3.55
183
1.6
3.2
7.3
16.8
Utah
546
259.2
74.5
4.02
3.27
163
0.5
1.1
1.8
3.8
Vermont
2,310
162.6
76.9
3.98
3.17
154
0.9
1.5
2.6
5.6
Virginia
1,885
150.8
75.4
3.83
3.07
215
1.1
2.8
5.5
9.5
Washington
657
586.1
76.6
4.14
3.24
175
0.3
1.2
2.1
6.2
West Virginia
157
83.7
68.0
3.84
3.09
211
1.3
3.2
6.4
9.6
Wisconsin
24,970
192.0
84.8
3.88
3.12
164
2.1
3.6
5.5
9.7
United States4
117,631
244.3
78.3
3.94
3.14
187
1.5
2.9
5.2
9.9
| 1All herd test days with usable records. |
| 2Cows with usable records (less than total cows on test). |
| 3Herd test days with ≥10 usable records. |
| 4US Average includes a few records from Mexican herds. |
| Table 2. National averages for test-day milk yield, somatic cell count (SCC), fat and protein percentages from Dairy Herd Improvement herds by year |
Herd test days1
Cows2 per herd
Average daily milk yield
Average Fat
Average Protein
Average SCC
Herd test days3 with SCC greater than
Year
(no.)
(no.)
(lb)
(%)
(%)
(cells/ml, 1000's)
750,000 cells/ml
(%)600,000 cells/ml
(%)500,000 cells/ml
(%)400,000 cells/ml
(%)
1995
265,844
50.0
65.3
304
4.1
9.3
16.0
27.2
1996
255,039
55.5
64.7
308
4.1
9.2
16.1
27.8
1997
287,789
57.4
66.4
314
4.2
9.5
16.6
28.8
1998
283,695
60.8
66.8
318
4.5
10.1
17.8
30.3
1999
273,364
67.0
68.2
311
4.3
9.7
17.1
29.8
2000
260,139
73.3
69.1
316
4.1
9.4
16.8
29.5
2001
244,940
79.1
69.0
322
4.9
10.6
18.2
31.1
20024
267,809
77.5
69.5
320
5.6
11.0
18.1
30.0
2003
251,182
80.5
69.6
319
5.6
11.2
18.4
30.4
2004
240,938
85.7
69.4
295
4.7
9.4
15.5
26.4
2005
234,585
90.3
71.1
296
4.7
9.2
15.3
25.8
20065
236,191
115.5
71.2
288
3.9
8.3
14.3
25.2
2007
227,626
125.1
71.4
276
3.5
7.6
13.4
24.0
2008
222,245
131.7
71.7
262
3.4
7.1
12.5
22.4
2009
204,195
136.1
72.1
233
2.7
5.8
10.3
18.9
2010
198,218
145.2
72.7
228
2.7
5.7
10.0
18.0
2011
191,375
154.6
73.1
217
2.3
4.8
8.5
15.7
2012
184,927
161.8
74.2
200
1.5
3.3
6.1
12.0
2013
177,944
167.8
75.2
199
1.5
3.2
5.9
11.6
2014
173,260
177.3
76.2
200
1.6
3.4
6.0
11.6
2015
166,970
185.9
77.2
204
1.6
3.3
6.0
11.6
2016
157,218
196.0
78.1
203
1.6
3.2
5.7
11.1
2017
149,130
202.5
78.1
197
1.6
3.2
5.7
10.8
2018
133,513
222.7
77.9
191
1.7
3.4
5.9
11.0
2019
117,631
244.3
78.3
3.94
3.14
187
1.5
2.9
5.2
9.9
Annual trend
-6,429
7.7***
0.6***
-6.7***
-0.2***
-0.4***
-0.6***
-1.0***
| 1All herd test days with usable records. |
| 2Cows with usable records (less than total cows on test). |
| 3Herd test days with ≥10 usable records. |
| 4Summary characteristics for 2002 were recalculated to include more complete data than were available at the time of initial reporting. |
| 5Cows per herd included records with missing sire identification starting in 2006; those records were not included in prior years. |
| ***Significant (P ≤ 0.001) linear regression. |
| Table 3. Characteristics of test-day milk yield, somatic cell count (SCC), fat and protein percentages from Dairy Herd Improvement herds during 2019 by herd size |
| Herd size1 | Herd test days2 | Cows3 per herd | Average daily milk yield | Average Fat | Average Protein | Average SCC | Herd test days4 with SCC greater than | |||
| (cows) | (no.) | (no.) | (lb) | (%) | (%) | (cells/ml, 1000's) | 750,000 cells/ml (%) |
600,000 cells/ml (%) |
500,000 cells/ml (%) |
400,000 cells/ml (%) |
| <50 | 43,545 | 26.9 | 64.2 | 3.94 | 3.13 | 230 | 3.6 | 6.3 | 9.9 | 16.0 |
| 50 - 99 | 31,846 | 69.9 | 69.9 | 3.91 | 3.14 | 210 | 0.5 | 1.6 | 3.9 | 9.4 |
| 100 - 149 | 11,703 | 120.8 | 72.5 | 3.93 | 3.15 | 199 | 0.2 | 0.7 | 2.0 | 6.1 |
| 150 - 199 | 5,888 | 172.6 | 74.9 | 3.89 | 3.14 | 197 | 0.2 | 0.9 | 2.0 | 5.5 |
| 200 - 299 | 6,669 | 242.7 | 77.2 | 3.91 | 3.15 | 191 | 0.1 | 0.3 | 1.7 | 4.8 |
| 300 - 499 | 5,915 | 387.3 | 81.1 | 3.89 | 3.11 | 180 | 0.2 | 0.4 | 0.7 | 2.4 |
| 500 - 999 | 5,790 | 690.2 | 82.5 | 3.89 | 3.11 | 181 | 0.0 | 0.2 | 0.7 | 2.1 |
| 1000 - 1999 | 3,748 | 1389.8 | 82.8 | 3.90 | 3.06 | 182 | 0.0 | 0.1 | 0.3 | 1.6 |
| 2000 - 2999 | 1,235 | 2421.5 | 82.9 | 3.95 | 3.12 | 181 | 0.1 | 0.2 | 0.3 | 1.9 |
| 3000 - 3999 | 648 | 3411.6 | 78.7 | 3.92 | 3.11 | 196 | 0.0 | 0.2 | 0.3 | 1.9 |
| >4000 | 644 | 7125.6 | 75.3 | 4.12 | 3.32 | 174 | 0.0 | 0.0 | 0.2 | 0.3 |
| All herds | 117,631 | 244.3 | 78.3 | 3.94 | 3.14 | 187 | 1.5 | 2.9 | 5.2 | 9.9 |
| 1Number of cows reported in milk. |
| 2All herd test days with usable records. |
| 3Cows with usable records (less than total cows on test). |
| 4Herd test days with ≥10 usable records. |
| Table 4. Characteristics of test-day milk yield, somatic cell score (SCC), fat and protein percentages from Dairy Herd Improvement herds during 2019 by month |
| Herd test days1 | Cows2 per herd | Average daily milk yield | Average Fat | Average Protein | Average SCC | Herd test days3 with SCC greater than | ||||
| Month | (no.) | (no.) | (lb) | (%) | (%) | (cells/ml, 1000's) | 750,000 cells/ml (%) |
600,000 cells/ml (%) |
500,000 cells/ml (%) |
400,000 cells/ml (%) |
| January | 10,247 | 236.8 | 78.0 | 4.02 | 3.18 | 185 | 1.5 | 3.0 | 5.0 | 9.7 |
| February | 9,824 | 241.3 | 78.4 | 4.01 | 3.18 | 189 | 1.5 | 2.7 | 4.9 | 9.4 |
| March | 10,816 | 244.1 | 78.3 | 3.98 | 3.16 | 185 | 1.6 | 2.9 | 5.0 | 9.3 |
| April | 9,811 | 237.8 | 79.3 | 3.91 | 3.12 | 184 | 1.2 | 2.2 | 4.1 | 8.2 |
| May | 10,197 | 244.5 | 79.6 | 3.87 | 3.10 | 184 | 1.2 | 2.3 | 4.2 | 8.5 |
| June | 9,997 | 243.3 | 79.5 | 3.83 | 3.06 | 191 | 1.4 | 2.7 | 4.7 | 9.5 |
| July | 9,272 | 248.2 | 78.0 | 3.80 | 3.03 | 208 | 2.0 | 4.3 | 8.0 | 14.5 |
| August | 9,882 | 241.0 | 78.1 | 3.82 | 3.06 | 207 | 2.2 | 4.4 | 7.4 | 13.9 |
| September | 9,186 | 247.6 | 77.5 | 3.89 | 3.12 | 193 | 1.6 | 3.3 | 6.1 | 11.6 |
| October | 9,724 | 247.2 | 77.5 | 4.01 | 3.20 | 182 | 1.5 | 3.0 | 5.3 | 10.3 |
| November | 9,272 | 251.8 | 77.1 | 4.09 | 3.24 | 166 | 1.2 | 2.1 | 3.7 | 7.2 |
| December | 9,403 | 249.1 | 77.8 | 4.08 | 3.24 | 168 | 1.3 | 2.2 | 4.1 | 7.5 |
| Yearly | 117,631 | 244.3 | 78.3 | 3.94 | 3.14 | 187 | 1.5 | 2.9 | 5.2 | 9.9 |
| 1All herd test days with usable records. |
| 2Cows with usable records (less than total cows on test). |
| 3Herd test days with ≥10 usable records. |
|
Figure 1. Average test-day somatic cell count from Dairy Herd Improvement herds during by state |
|
Figure 2. Average test-day milk yield and somatic cell count (SCC) from Dairy Herd Improvement herds during by month |
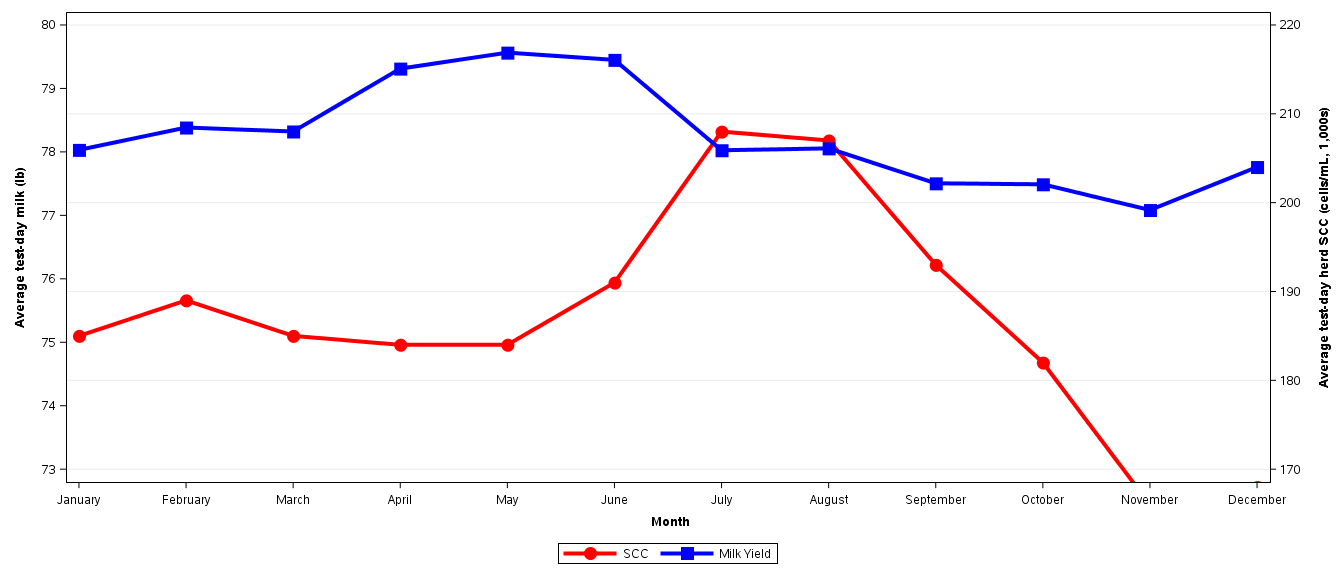
Figure 3. Average fat and protein percentages from Dairy Herd Improvement herds during by month
We wish to acknowledge the contribution of the dairy producers who supplied data for this report through their participation in the DHI program and the Dairy Records Processing Centers that processed and relayed the information on to the Council on Dairy Cattle Breeding (CDCB).